Today, even basic Windows apps like the alarm and clock And the calculator Designed to allow you to perform a variety of tasks in addition to the obvious routine work, the Calculator app has introduced a new mode for all users in the May 2020 release of Windows 10. As the name suggests, it can be used to plot equations and analyze functions. This graphing mode is very useful if you are a student or an employee giving presentations, especially if your career is in mechanical and architectural fields. Although, for most users, the graphing mode is disabled or disabled by default. Therefore, it needs to be enabled manually. Today, we will teach you how to enable or disable the Calculator graphing mode in Windows 10.

How to Enable Calculator Graphing Mode in Windows 10
The calculator app itself contains: Four different modes Included with it is a set of adapters.
- The first is called Standard mode Which will allow you to perform basic mathematical operations.
- Next is Scientific status Which allows you to perform advanced calculations using trigonometric functions and exponents.
- And it is followed by Programmer mode To perform programming-related calculations.
- Finally, Chart mode New to plot equations on a graph.
Why is graphing mode enabled on the calculator?
- Helps you Visualize the concept of algebraic equations Such as functions, polynomials, quadratics.
- Allows you to work on Polar and bounded graphs Which is difficult to draw on paper.
- In trigonometry functions, it helps you to: Knowing the amplitude, period, and phase shift.
- In programming, if your projects depend on Datasets and Spreadsheets , you can rely on for accurate data.
Enabling graphing mode in the Calculator app is actually a very easy task and involves editing the Group Policy Editor or the Windows Registry. Both apps store important settings related to the Windows operating system and its applications, so be extremely careful when following the steps to avoid triggering any errors or completely damaging your system. In this article, we detail two different methods for enabling graphing mode in the Calculator operating system. Windows 10 We also provide basic guidelines for the form at the end.
Method 1: Through the Local Group Policy Editor
This method works if you're using the Professional and Enterprise editions of Windows 10. However, if you're using the Home edition, you won't be able to access the Group Policy Editor. So, try the other method.
Step 10: Determine your Windows XNUMX version
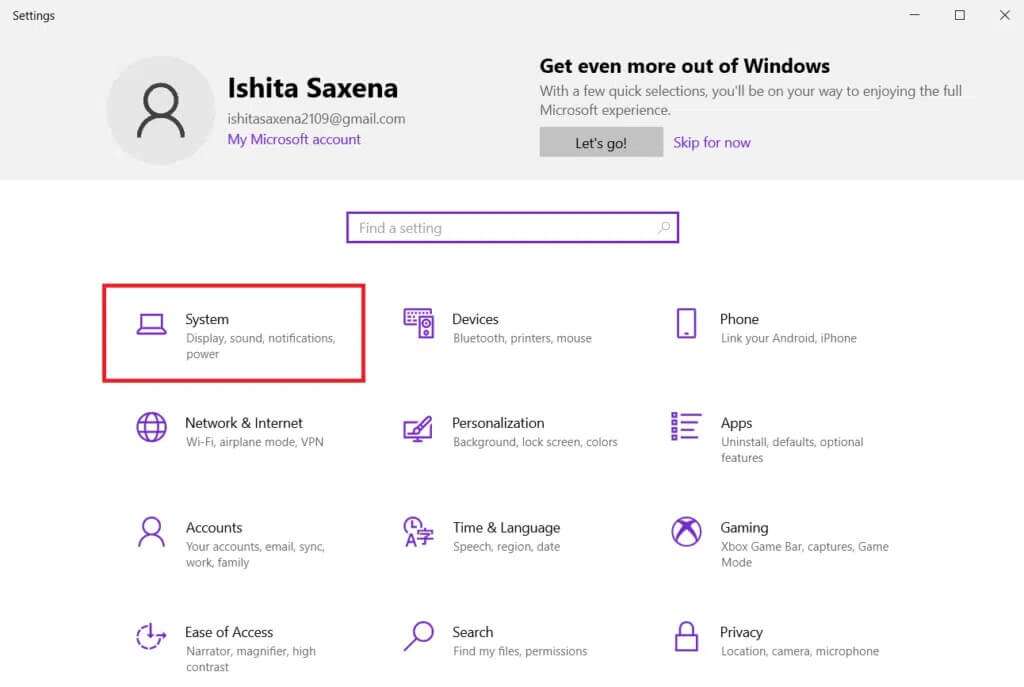
1. Open Settings by pressing the keys Windows + I Together, then select the system , as shown.
2. Click About in the right pane.
3. Check the section Windows Specifications.
Step 10: Enable or disable Calculator Graphing Mode in Windows XNUMX
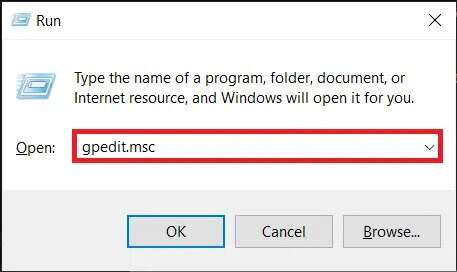
1. Press the keys Windows + R At the same time to open the dialog box "employment".
2. Write gpedit.msc and click the . button "OK" to start Local Group Policy Editor.
3. Go to User Configuration > Administrative Templates > Windows Components > Calculator On the right side by clicking on the arrow icon next to each folder.
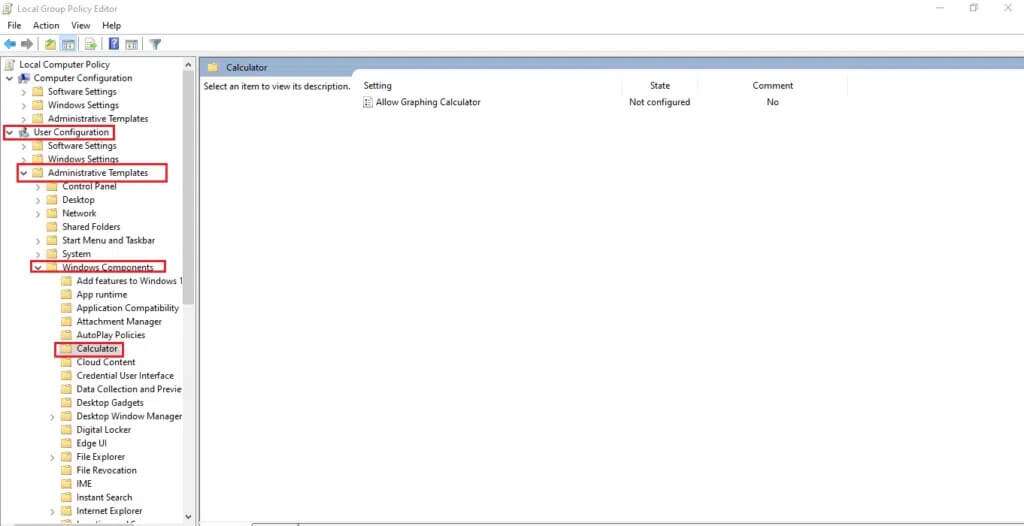
4. Click Allow graphing calculator input In the right pane. Next, select the option Policy preparation Distinctively illustrated.
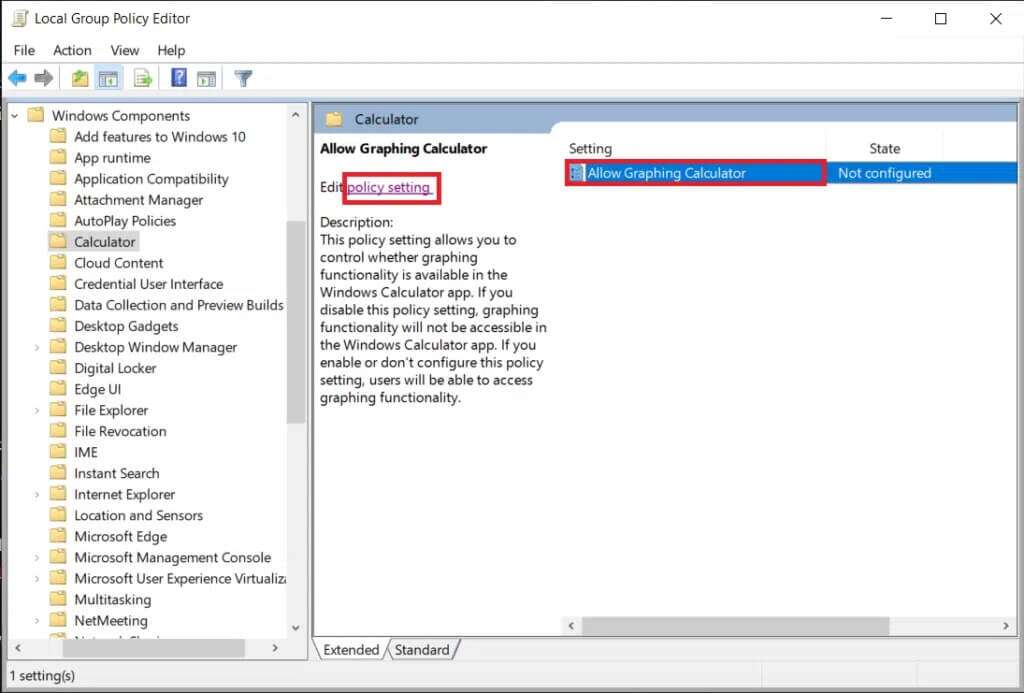
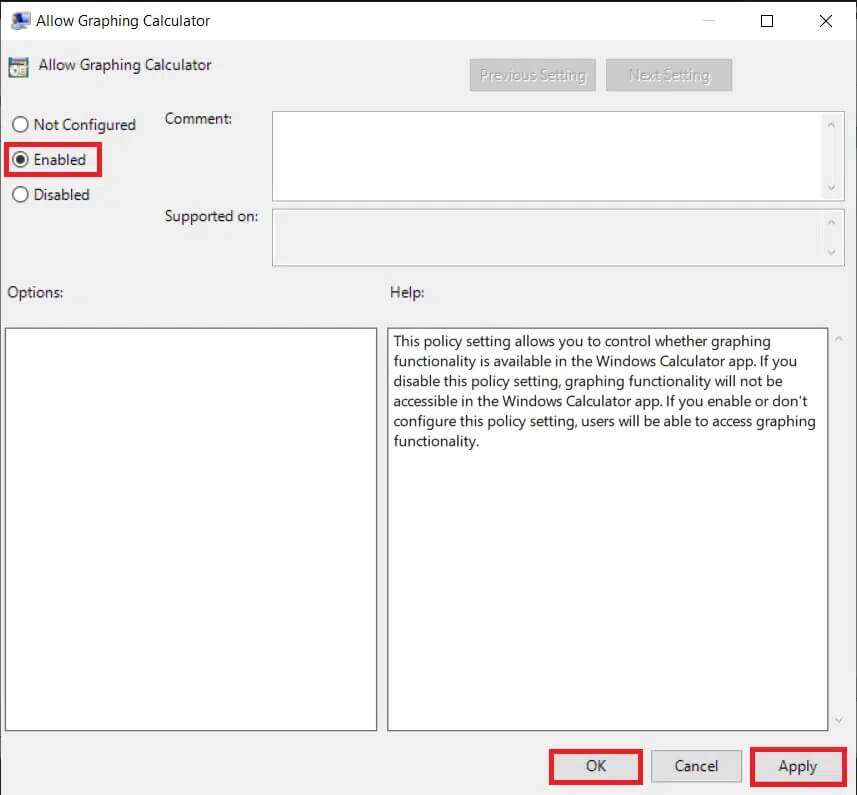
5. Click the radio button. Maybe And click "Application" to save the changes.
Note: If you have not previously modified the entry, it will be in the following state: “Not configured” default.
6. Close All Programs And do the Reboot the system.
7. The Calculator app will display the graphing option once you restart your computer.
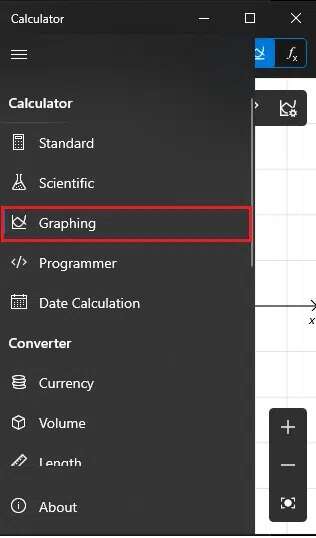
Note: To disable the graphing calculator on a Windows 10 computer, select the Disabled option in step 5.
Method 2: Through the Registry Editor
If for some reason you're unable to enable graphing mode from the Group Policy Editor, editing the Windows Registry will also do the trick. Follow the steps below to enable or disable Calculator graphing mode on Windows 10 computers:
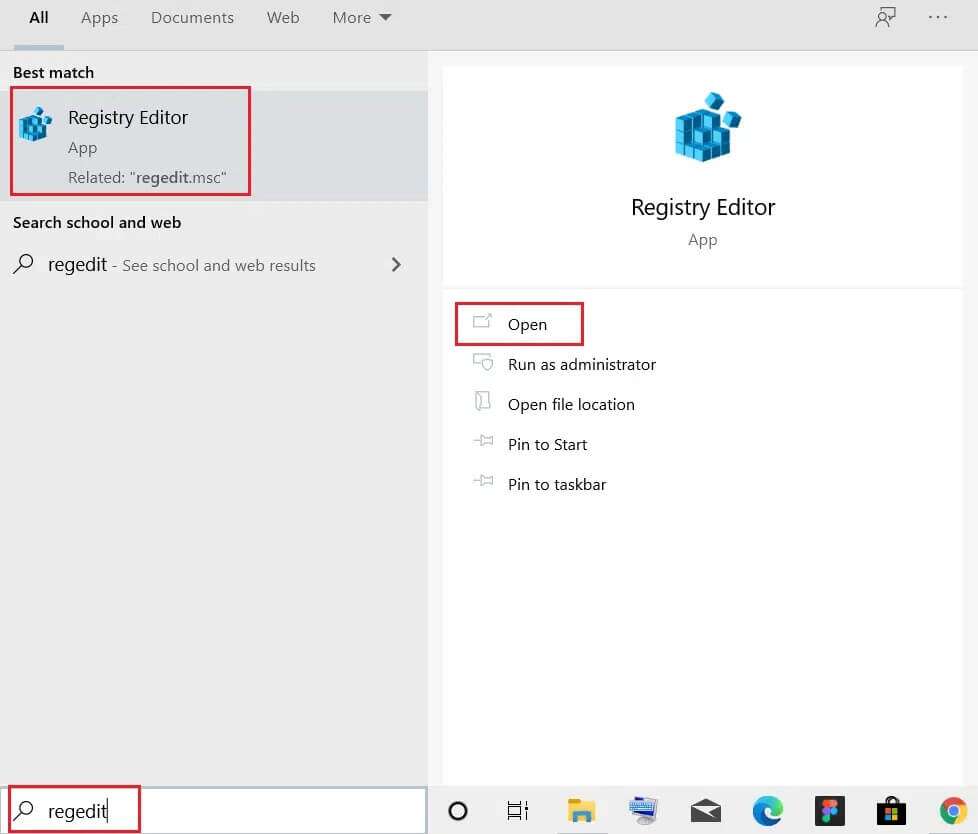
1. Click START YOUR , And type regedit , and click open To run the registry editor.
2. Paste the following website path into the address bar and press the key: Enter.
HKEY_CURRENT_USER\SOFTWARE\Microsoft\Windows\CurrentVersion\Policies\Calculator
Note: It's very likely that you didn't find the Calculator folder. You'll need to create one manually. Right-click Policies, click New, and then select Key. Name the key Calculator.
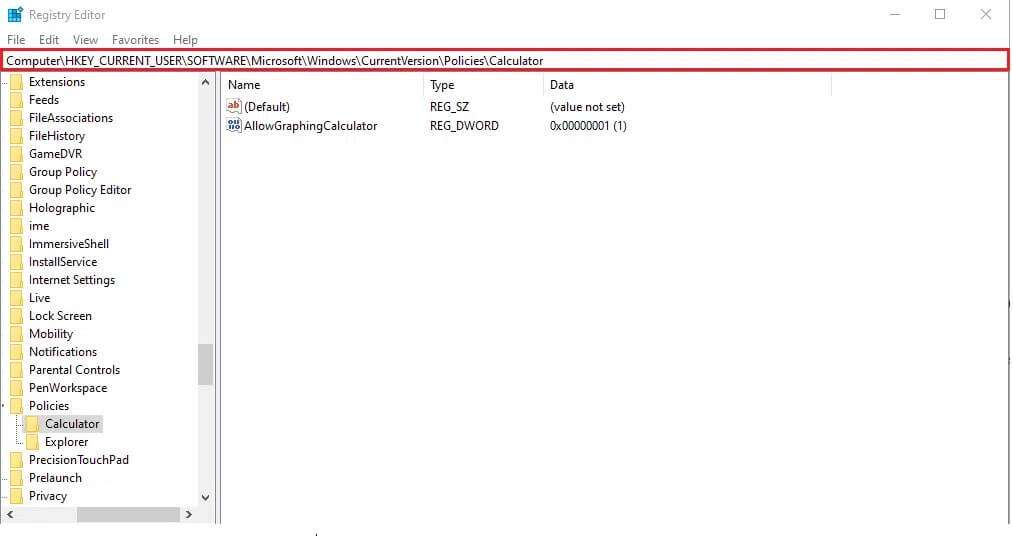
Note: If the Calculator key already exists on your computer, the AllowGraphingCalculator value is likely there as well. Otherwise, you'll need to create the value manually again.
3. Right-click on the empty space. Click New > DWORD (32-bit) ValueName the value as AllowGraphingCalculator.
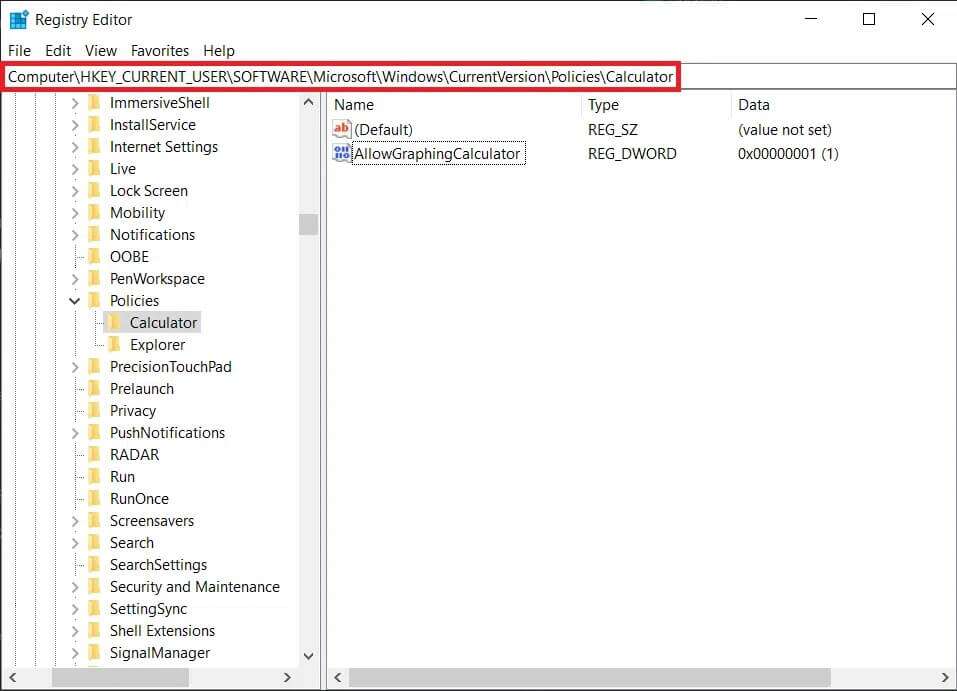
4. Now, right-click on AllowGraphingCalculator And click Modify.
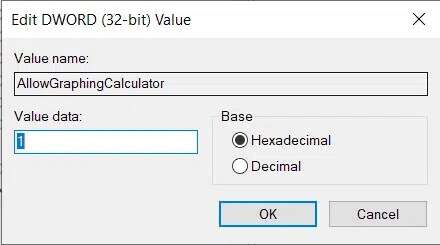
5. Type 1 under Value data to enable the feature. Click "OK" To save.
6. Exit Registry Editor and restart your computer.
Note: If you want to disable the charting mode in the future, change the value data to 0 in step 5.
How to use the calculator's graphing mode
Step 1: Access chart mode
1. Open an app Calculator.
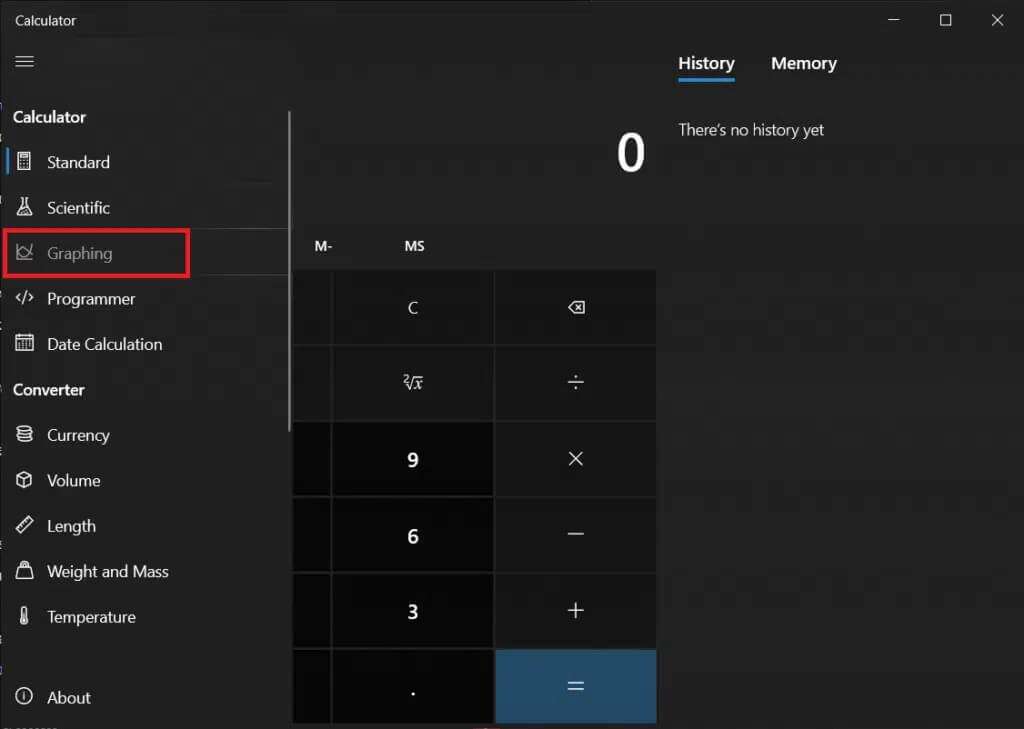
2. Click on Fonts iconThreejurist Located in the upper left corner.
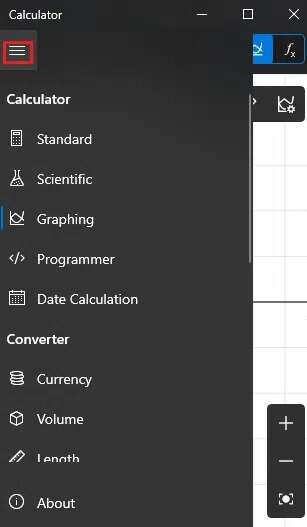
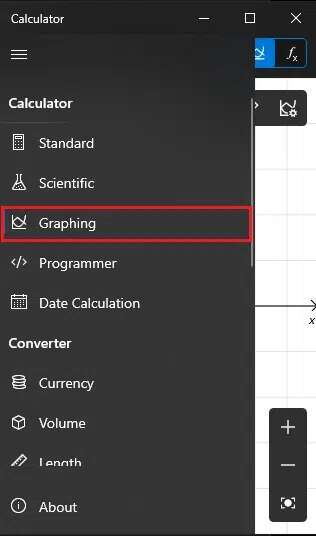
3. In the next menu, click Graph , as shown.
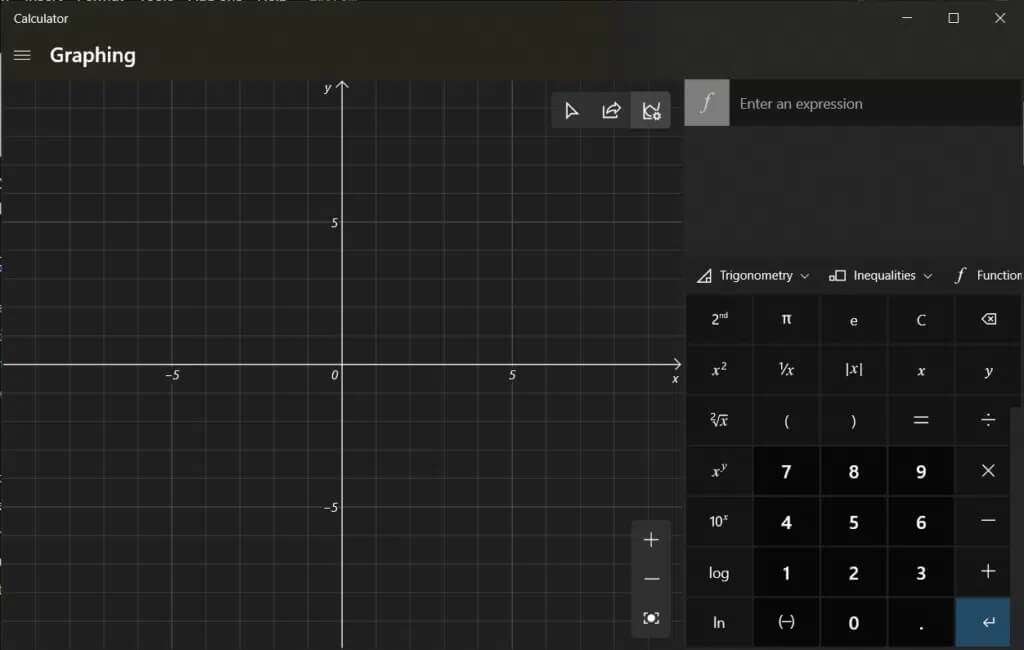
4. Within a split second, you'll be greeted with a blank graph on the right and a familiar-looking calculator numeric pad on the right, as shown below.
Step 2: Graph the equations
1. Enter equations (e.g., x+1, x-2) in the upper right fields of fields f1 and f2, as shown.
2. Simply, press Enter On the keyboard after writing the equation to draw it.
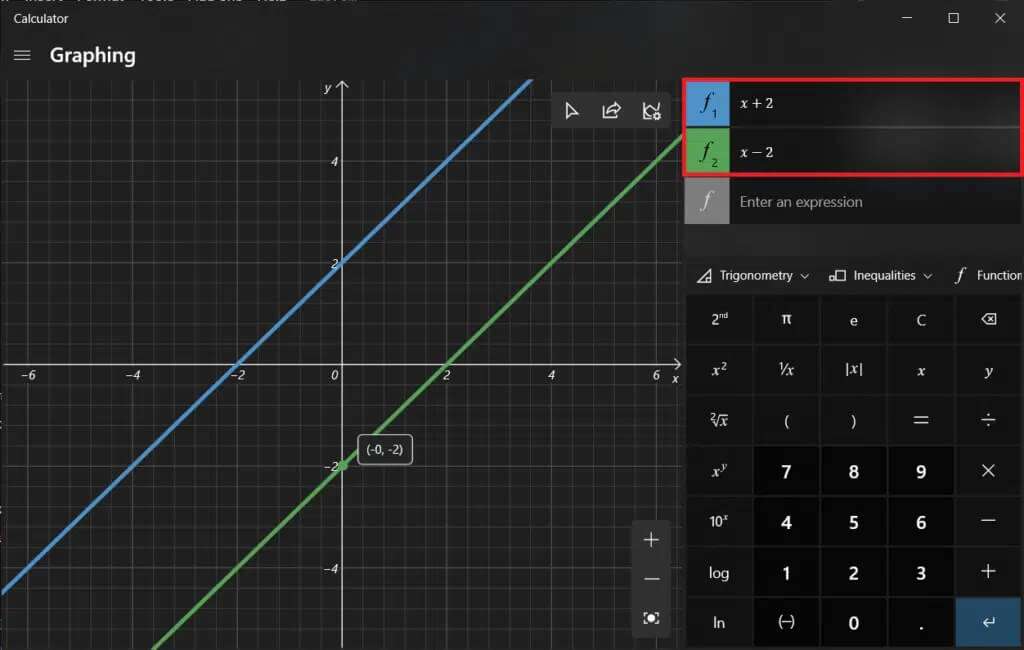
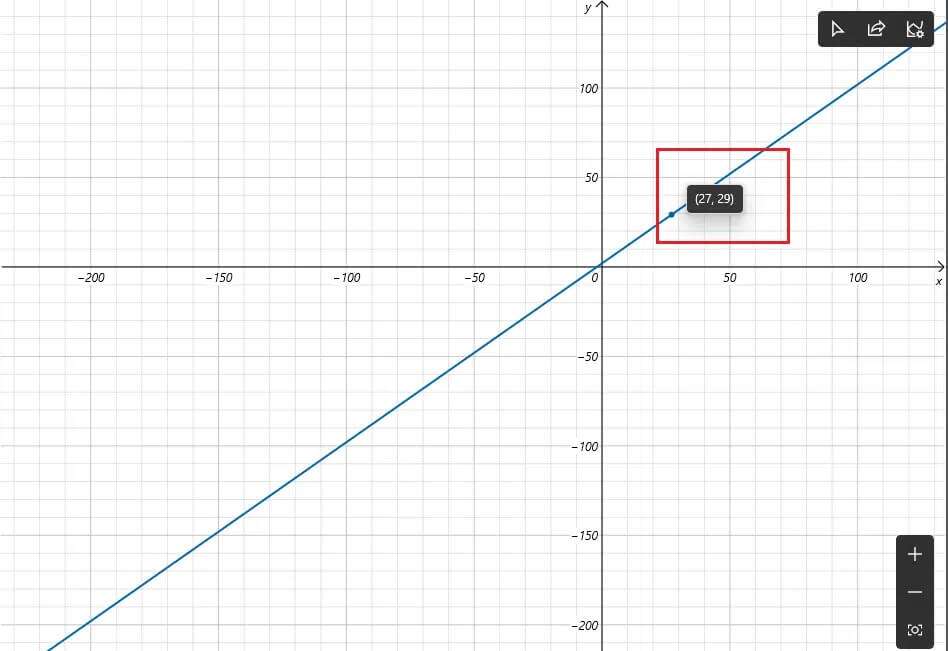
3. Hover your mouse over the drawn line to receive the exact coordinates of that point, as shown below.
Step 3: Analyze the equations
Aside from graphing equations, graphing mode can also be used to analyze equations, although not all of them are used. To check the functional analysis of an equation, click lightning symbol Next to it.

Step 4: Change the font style
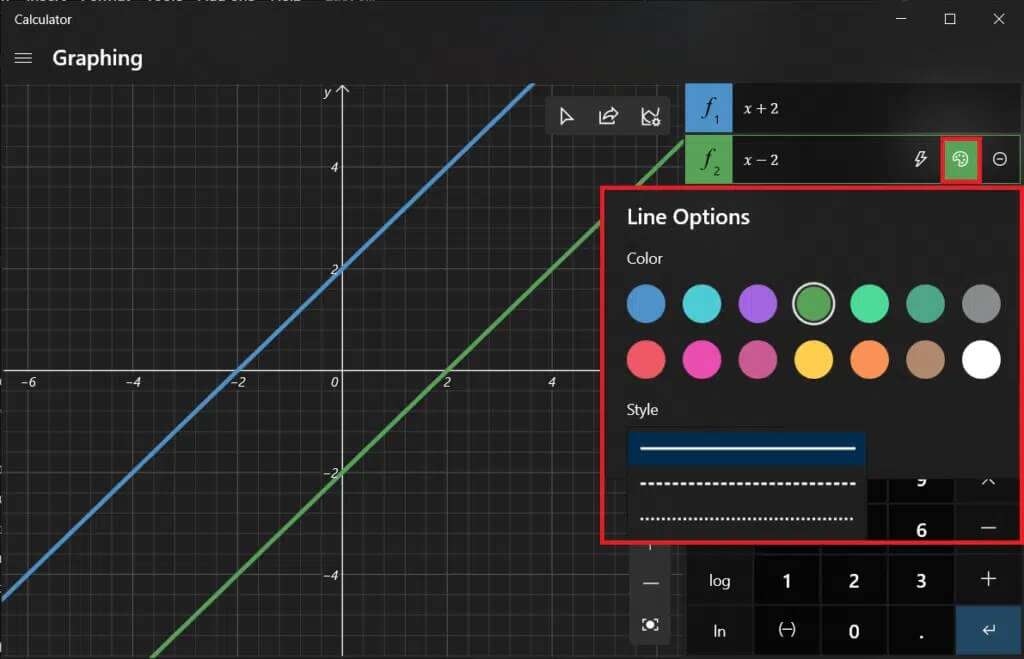
1. Click color palette icon To open Font options.
2a. This will allow you to change the style of the drawn line as follows:
- Normal
- dotted
- intermittent
2b. Specify the color From the available color options.
Step 5: Use chart options
Once the equations are set, three new options become active in the upper right corner of the chart window.
1. The first option allows you to trace lines drawn using the mouse or keyboard.
2. The next step is to share the chart via email.
3. Finally, it allows you to customize the chart which allows you to:
- Adjust the minimum and maximum values of X and Y,
- Switch between different units such as degrees, radians, and centimeters,
- Adjust line thickness and
- Change the chart theme.

We hope the above method helped you enable, use, or disable the calculator drawing mode in Windows 10. Drop your queries/suggestions below and share with us all the crazy graphs you draw using it.


